Revenue Analytics 2.0 Playbook: Operationalizing Leading Indicators – Part 2
Rachit Puri

Delivery Partner
In Revenue Analytics 2.0 Part 1, we established the competitive advantage of leading indicators over lagging ones. We covered eight key categories for revenue analytics. In Part 2, we cover how to operationalize them i.e., how to build, trigger, and act on leading indicators.
The Operationalization Framework
Revenue Analytics needs dashboards include actionable metrics for your team. Revenue metrics become actionable when every leading indicator is tied to:
- A clear definition and shared understanding
- A clean system of record
- Threshold-based alerts
- Automated notifications
- Role-specific playbooks
Without structure, leading indicators remain noise. The five-step framework below makes sure every signal in Salesforce or HubSpot is tracked, triggered, and acted on in real time.
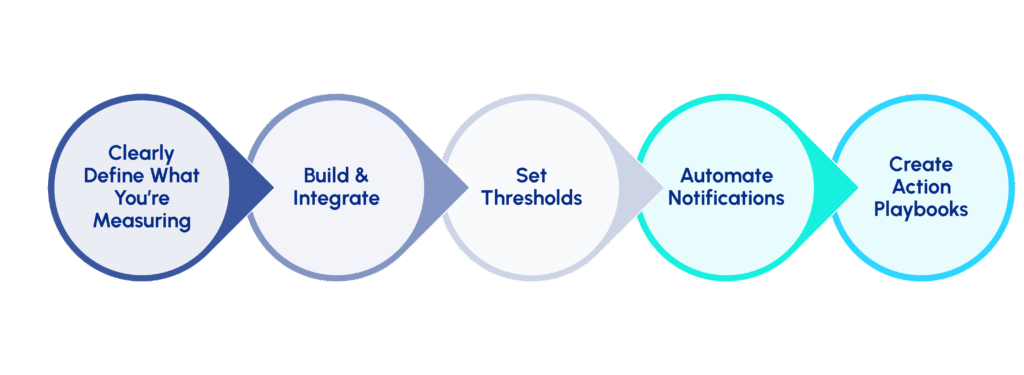
- Clearly Define Metrics
What exactly are you measuring, how well is that working, and what could you measure to identify trends and future performance?
Every leading indicator needs five components:- Clear definition: What behavior or outcome does this metric represent?
- Shared understanding: Ensure Marketing, Sales, CS, and RevOps all agree on the definition so the KPI drives aligned action rather than debate.
- Calculation formula: Exactly how is it computed from your data sources?
- Data sources: Which systems, objects, and fields feed into the calculation?
- Predictability: At what conversion % (current and trending), web form submissions are progressing through the funnel to create sales pipeline and become customers?
- Build & Integrate
Where does the data live, and how do you surface it?
This step involves:- Establishing data points: Identify which fields and properties need to be captured and standardized across systems.
- Report configuration: Define reporting logic in your CRM, MAP, or BI tool.
- Dashboard placement: Position metrics in dashboards segmented by role for clear visibility.
- Data pipeline setup: Connect cross-system metrics with native integrations or middleware.
- Refresh schedules: Align update frequency (hourly, daily) with how fast decisions must be made.
- Set Thresholds
When should the system alert you to take action?
Define trigger points based on:- Historical baselines: Establish what “normal” performance looks like for your business.
- Seasonal patterns: Adjust thresholds to account for predictable fluctuations by quarter, campaign cycle, or buying season.
- Segment variations: Calibrate thresholds differently for regions, products, or personas where conversion rates naturally vary.
- Urgency levels: Define yellow flag vs. red flag conditions to prioritize alerts and responses appropriately.
- Automate Notifications
How do alerts reach the right people instantly?
Build CRM / Slack / email notification workflows with:- Role-based routing: Send alerts to the right stakeholders based on metric ownership.
- Contextual detail: Include the metric value, threshold breached, and prescribed next steps in the alert message.
- Escalation rules: Define how and when alerts are escalated if action isn’t taken within SLA.
- Tool integration: Push notifications through Slack, Teams, or email to embed seamlessly into existing workflows.
- Create Action Playbooks
What specific steps does each role take when triggered?
Document the exact response for each stakeholder:- Immediate actions: Define what must happen within the first 24 hours of an alert.
- Investigation steps: Outline how teams diagnose the root cause of the metric breach.
- Corrective measures: Prescribe changes needed to fix the underlying issue.
- Follow-up cadence: Establish how often the team checks whether the fix is working.
Analytics Playbook examples by Category
In Part 1, we introduced the eight categories of leading indicators: progression, engagement, risk, activity-to-outcome, and efficiency. Each category contains multiple signals that can guide GTM decisions in real time.
Here, we’ll show you how to operationalize one representative example from each category inside your CRMs like Salesforce, Dynamics, or HubSpot — and how the same framework extends to the rest.
1. Funnel Progression Indicators
These indicators track how prospects move through the funnel and surface bottlenecks that slow pipeline velocity. For example, if MQL-to-SQL conversion exceeds five days, SDR managers enforce SLAs and RevOps audits routing to restore flow. The same model applies to metrics like pipeline coverage, SQL-to-Opportunity conversion time, or active buying group engagement.
Implementation: You can operationalize this in your CRM by defining velocity metrics as custom fields or reports (e.g., MQL-to-SQL conversion time, stage-ageing). Set up workflow alerts and SLAs that trigger when thresholds are breached (e.g., >5 business days). Use dashboards and segment filters to track by region, persona, or product. Finally, enable task automation for SDR/AE follow-ups so pipeline progression issues are flagged and acted on in real time.
2. Engagement Quality Indicators
These indicators measure whether the right accounts are engaging in the right ways. For example, if ICP match rate on inbound leads drops below 60%, Marketing Ops tightens targeting filters and reallocates spend toward high-value accounts. The same model applies to metrics like weighted content engagement scores or buying committee activity across channels.
Implementation: Configure ICP scoring fields in your marketing automation platform / CRM using firmographic and demographic data. Create automated triggers to track engagement scores, and monitor engagement quality. Build alerts that fire when the ICP match rate and weighted engagement cross the threshold. Tie notifications to campaign managers and SDRs for immediate action.
3. Pre-Sale Account & Opportunity Risk Indicators
These indicators flag disengagement or usage decline before opportunities slip. For example, if product trial engagement drops significantly or three or more buying group contacts go dark for 10 days, AEs and CS launch a joint save play. The same model applies to signals like stalled multi-contact engagement, unresolved support tickets, or lack of campaign interaction tied to open deals.
Implementation: Monitor multi-contact activity using Salesforce Opportunity Contact Role reporting or HubSpot deal-contact associations. Layer in HubSpot campaign reporting to track whether buying group members are engaging with campaigns tied to open opportunities.
Set threshold-based alerts when engagement streaks break (e.g., no activity in 10 days), or when trial usage drops below a defined level.
Integrate product usage and support ticket data to expand signal coverage and surface hidden risk. When risk is detected, trigger AE-CS playbooks automatically through tasks, Slack alerts, or email notifications to coordinate save motion efforts.
4. Sales Activity-to-Outcome Indicators
These indicators tie rep activity directly to pipeline creation. For example, if the meetings booked-to-SQL ratio falls below 20%, Sales Enablement reviews call quality and RevOps inspects ICP alignment. The same model applies to SLA compliance on MQL follow-ups, outbound response rates, and opportunity creation per activity.
Implementation: Build Salesforce reports comparing activities logged vs. pipeline outcomes (e.g., booked meetings vs. SQLs). Configure ratio thresholds and monitor by rep/team. Use automated coaching triggers like flagging reps below benchmark and provide dashboards to Sales Enablement for training.
5. Campaign Efficiency Indicators
These indicators separate campaign vanity metrics from true revenue contribution. For example, if a campaign drives high engagement but <5% MQL conversion, Marketing reallocates budget toward higher-performing assets. The same model applies to first-touch ICP influence rates, multi-touch conversion probability, or content-assisted opportunity creation.
Implementation: Use Salesforce Campaign Influence or HubSpot Touchpoint Reporting to connect engagement with SQL and opportunity creation, moving toward a lifecycle-driven attribution model that ties campaigns directly to revenue. Set alerts for campaigns with strong engagement but weak pipeline impact. Enable dashboards for real-time budget allocation, ensuring spend shifts mid-quarter rather than post-mortem.
6. Customer Success Leading Indicators
These indicators predict adoption and retention risk. For example, if customer health scores drop 10% in 30 days, CS initiates enablement sessions and exec alignment. The same model applies to unactivated licenses or missed QBRs.
Implementation: In Salesforce, calculate health scores with product usage and NPS data. In HubSpot, track adoption through customer health properties or CS integrations. Configure alerts for score declines or license gaps. Automate CS renewal playbooks when thresholds are breached. CS teams can also deploy behavioral trigger automation for PLG to identify early adoption risks and trigger re-engagement playbooks before accounts slip.
7. Post-Sale Account & Opportunity Risk Indicators
These indicators surface renewal risk before churn. For example, if product usage velocity drops 30 days before renewal, CS launches a re-engagement sequence with tailored support. The same model applies to unresolved ticket surges or sponsor disengagement.
Implementation: In Salesforce, integrate product usage and support data into account dashboards. In HubSpot, track health via custom properties or Service Hub ticket reporting. Configure alerts for usage dips or SLA breaches. Automate CS tasks and AE escalations when thresholds trigger.
8. Customer Support Leading Indicators
These indicators expose dissatisfaction before churn. For example, if backlog aging exceeds 7 days on Tier 1 accounts, Support reallocates resources and initiates proactive outreach. The same model applies to SLA breaches, rising reopen rates, or escalation frequency.
Implementation: In Salesforce Service Cloud, monitor SLA dashboards and backlog reports. In HubSpot Service Hub, track ticket SLAs and reopen rates. Configure alerts for rising escalation metrics. Automate ticket routing and proactive outreach workflows to protect customer satisfaction.
Operationalizing Revenue Analytics 2.0
Revenue Analytics 2.0 bridges that gap by embedding actionable insights, and intelligence directly into your go-to-market systems. RevOps Global helps sales, marketing, and operations teams to build this operational layer through our Revenue Analytics Playbook Implementation session. In this hands-on engagement, we’ll help you:
- Identify and establish key leading indicators across functions, and systems
- Set up real-time tracking, alerts and notifications in your systems
- Create actionable dashboards and playbooks aligned with GTM motion
- Build governance systems to ensure data accuracy and system trust
Book your Revenue Analytics Playbook Implementation session.