Revenue Analytics 2.0 Playbook: Operationalizing Leading Indicators – Part 2

In Revenue Analytics 2.0 Part 1, we established the competitive advantage of leading indicators over lagging ones. We covered eight key categories for revenue analytics. In Part 2, we cover how to operationalize them i.e., how to build, trigger, and act on leading indicators.


Revenue Analytics needs dashboards include actionable metrics for your team. Revenue metrics become actionable when every leading indicator is tied to:

  • A clear definition and shared understanding
  • A clean system of record
  • Threshold-based alerts
  • Automated notifications
  • Role-specific playbooks

Without structure, leading indicators remain noise. The five-step framework below makes sure every signal in Salesforce or HubSpot is tracked, triggered, and acted on in real time.
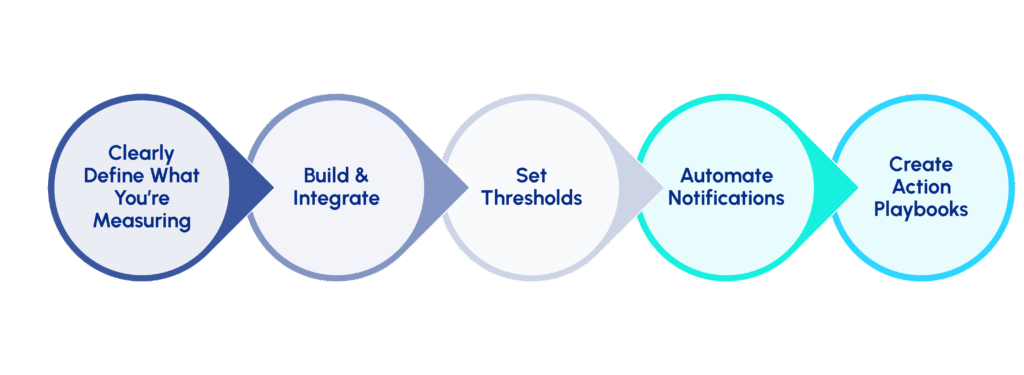
  1. Clearly Define Metrics
    What exactly are you measuring, how well is that working, and what could you measure to identify trends and future performance?
    Every leading indicator needs five components:
    • Clear definition: What behavior or outcome does this metric represent?
    • Shared understanding: Ensure Marketing, Sales, CS, and RevOps all agree on the definition so the KPI drives aligned action rather than debate.
    • Calculation formula: Exactly how is it computed from your data sources?
    • Data sources: Which systems, objects, and fields feed into the calculation?
    • Predictability: At what conversion % (current and trending), web form submissions are progressing through the funnel to create sales pipeline and become customers?

  2. Build & Integrate
    Where does the data live, and how do you surface it?
    This step involves:
    • Establishing data points: Identify which fields and properties need to be captured and standardized across systems.
    • Report configuration: Define reporting logic in your CRM, MAP, or BI tool.
    • Dashboard placement: Position metrics in dashboards segmented by role for clear visibility.
    • Data pipeline setup: Connect cross-system metrics with native integrations or middleware.
    • Refresh schedules: Align update frequency (hourly, daily) with how fast decisions must be made.

  3. Set Thresholds
    When should the system alert you to take action?
    Define trigger points based on:
    • Historical baselines: Establish what “normal” performance looks like for your business.
    • Seasonal patterns: Adjust thresholds to account for predictable fluctuations by quarter, campaign cycle, or buying season.
    • Segment variations: Calibrate thresholds differently for regions, products, or personas where conversion rates naturally vary.
    • Urgency levels: Define yellow flag vs. red flag conditions to prioritize alerts and responses appropriately.

  4. Automate Notifications
    How do alerts reach the right people instantly?
    Build CRM / Slack / email notification workflows with:
    • Role-based routing: Send alerts to the right stakeholders based on metric ownership.
    • Contextual detail: Include the metric value, threshold breached, and prescribed next steps in the alert message.
    • Escalation rules: Define how and when alerts are escalated if action isn’t taken within SLA.
    • Tool integration: Push notifications through Slack, Teams, or email to embed seamlessly into existing workflows.

  5. Create Action Playbooks
    What specific steps does each role take when triggered?
    Document the exact response for each stakeholder:
    • Immediate actions: Define what must happen within the first 24 hours of an alert.
    • Investigation steps: Outline how teams diagnose the root cause of the metric breach.
    • Corrective measures: Prescribe changes needed to fix the underlying issue.
    • Follow-up cadence: Establish how often the team checks whether the fix is working.

In Part 1, we introduced the eight categories of leading indicators: progression, engagement, risk, activity-to-outcome, and efficiency. Each category contains multiple signals that can guide GTM decisions in real time.

Here, we’ll show you how to operationalize one representative example from each category inside your CRMs like Salesforce, Dynamics, or HubSpot — and how the same framework extends to the rest.


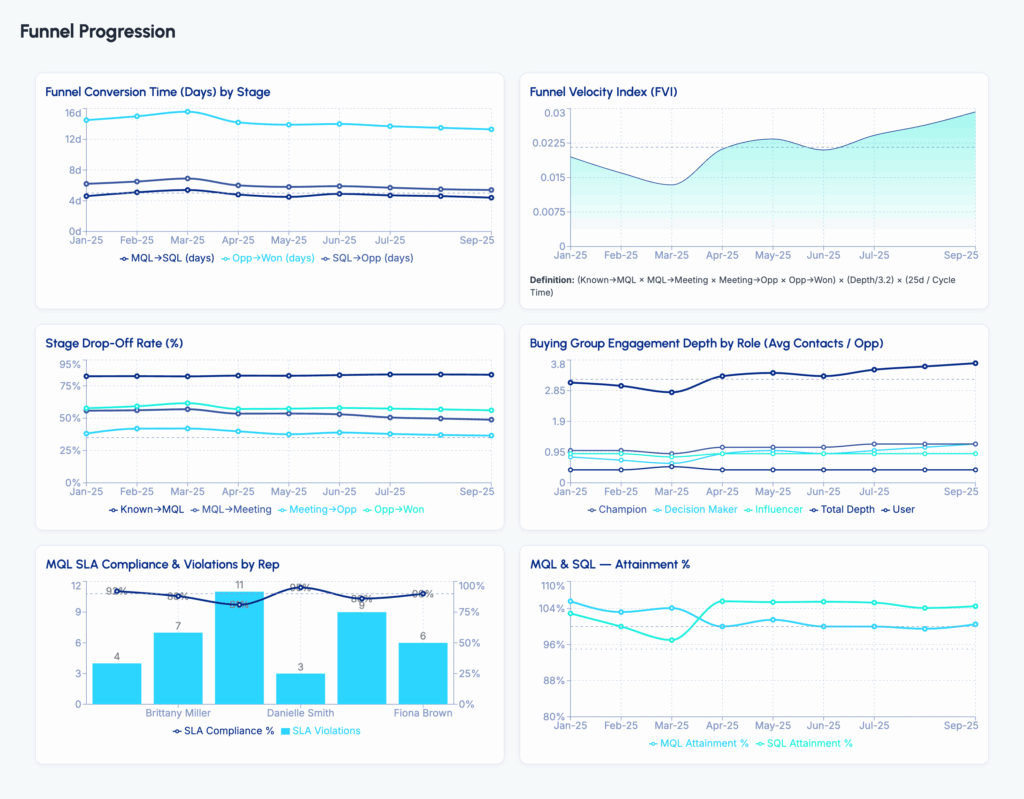
1. Funnel Progression Indicators

These indicators track how prospects move through the funnel and surface bottlenecks that slow pipeline velocity. For example, if MQL-to-SQL conversion exceeds five days, SDR managers enforce SLAs and RevOps audits routing to restore flow. The same model applies to metrics like pipeline coverage, SQL-to-Opportunity conversion time, or active buying group engagement.

Implementation: You can operationalize this in your CRM by defining velocity metrics as custom fields or reports (e.g., MQL-to-SQL conversion time, stage-ageing). Set up workflow alerts and SLAs that trigger when thresholds are breached (e.g., >5 business days). Use dashboards and segment filters to track by region, persona, or product. Finally, enable task automation for SDR/AE follow-ups so pipeline progression issues are flagged and acted on in real time.

2. Engagement Quality Indicators

These indicators measure whether the right accounts are engaging in the right ways. For example, if ICP match rate on inbound leads drops below 60%, Marketing Ops tightens targeting filters and reallocates spend toward high-value accounts. The same model applies to metrics like weighted content engagement scores or buying committee activity across channels.

Implementation: Configure ICP scoring fields in your marketing automation platform / CRM using firmographic and demographic data. Create automated triggers to track engagement scores, and monitor engagement quality. Build alerts that fire when the ICP match rate and weighted engagement cross the threshold. Tie notifications to campaign managers and SDRs for immediate action.
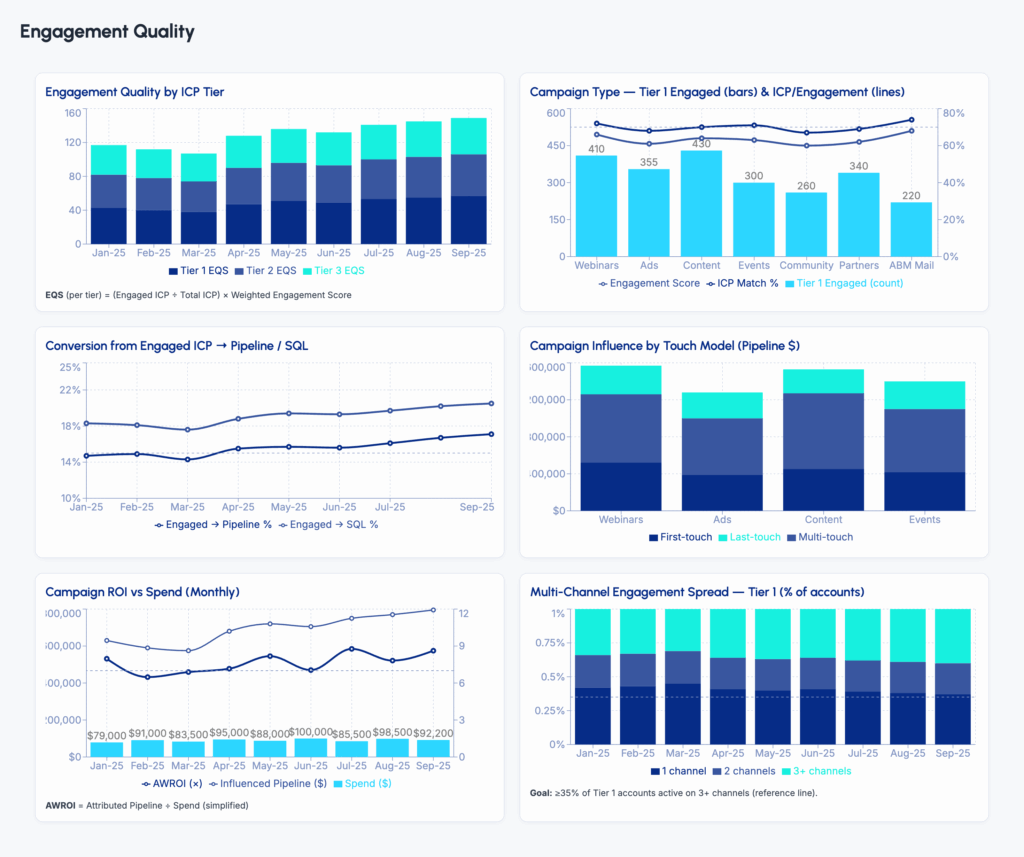

Marketing Campaign Influence Tracking in Salesforce

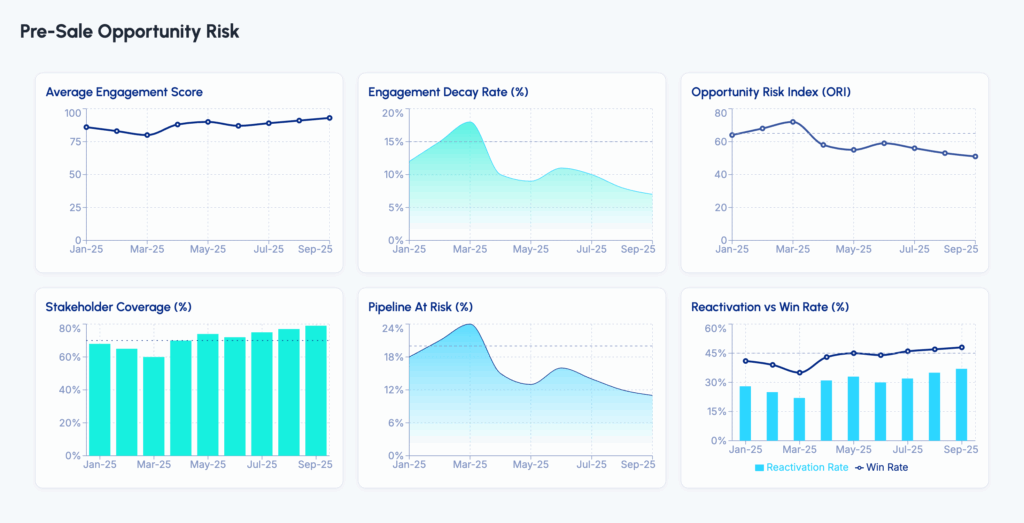
3. Pre-Sale Account & Opportunity Risk Indicators

These indicators flag disengagement or usage decline before opportunities slip. For example, if product trial engagement drops significantly or three or more buying group contacts go dark for 10 days, AEs and CS launch a joint save play. The same model applies to signals like stalled multi-contact engagement, unresolved support tickets, or lack of campaign interaction tied to open deals.

Implementation: Monitor multi-contact activity using Salesforce Opportunity Contact Role reporting or HubSpot deal-contact associations. Layer in HubSpot campaign reporting to track whether buying group members are engaging with campaigns tied to open opportunities.
Set threshold-based alerts when engagement streaks break (e.g., no activity in 10 days), or when trial usage drops below a defined level.
Integrate product usage and support ticket data to expand signal coverage and surface hidden risk. When risk is detected, trigger AE-CS playbooks automatically through tasks, Slack alerts, or email notifications to coordinate save motion efforts.

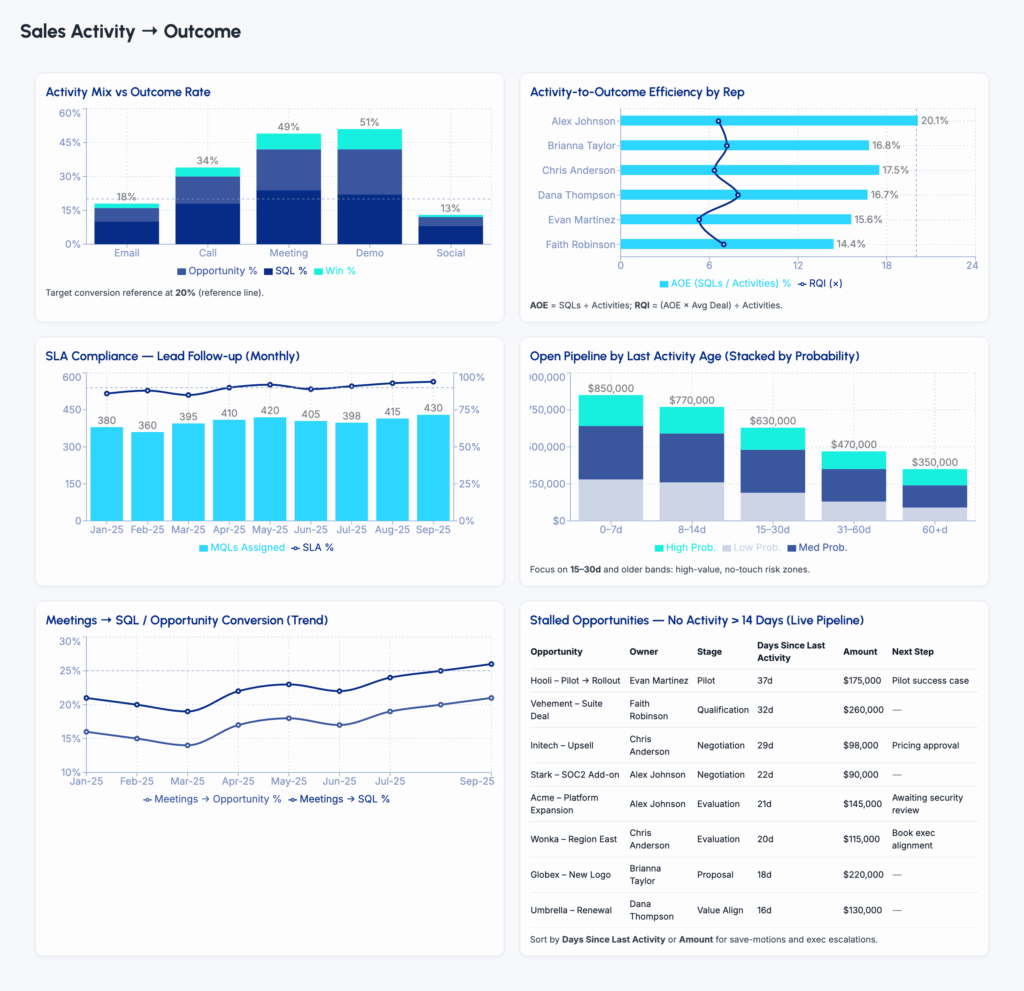
4. Sales Activity-to-Outcome Indicators

These indicators tie rep activity directly to pipeline creation. For example, if the meetings booked-to-SQL ratio falls below 20%, Sales Enablement reviews call quality and RevOps inspects ICP alignment. The same model applies to SLA compliance on MQL follow-ups, outbound response rates, and opportunity creation per activity.

Implementation: Build Salesforce reports comparing activities logged vs. pipeline outcomes (e.g., booked meetings vs. SQLs). Configure ratio thresholds and monitor by rep/team. Use automated coaching triggers like flagging reps below benchmark and provide dashboards to Sales Enablement for training.

5. Campaign Efficiency Indicators

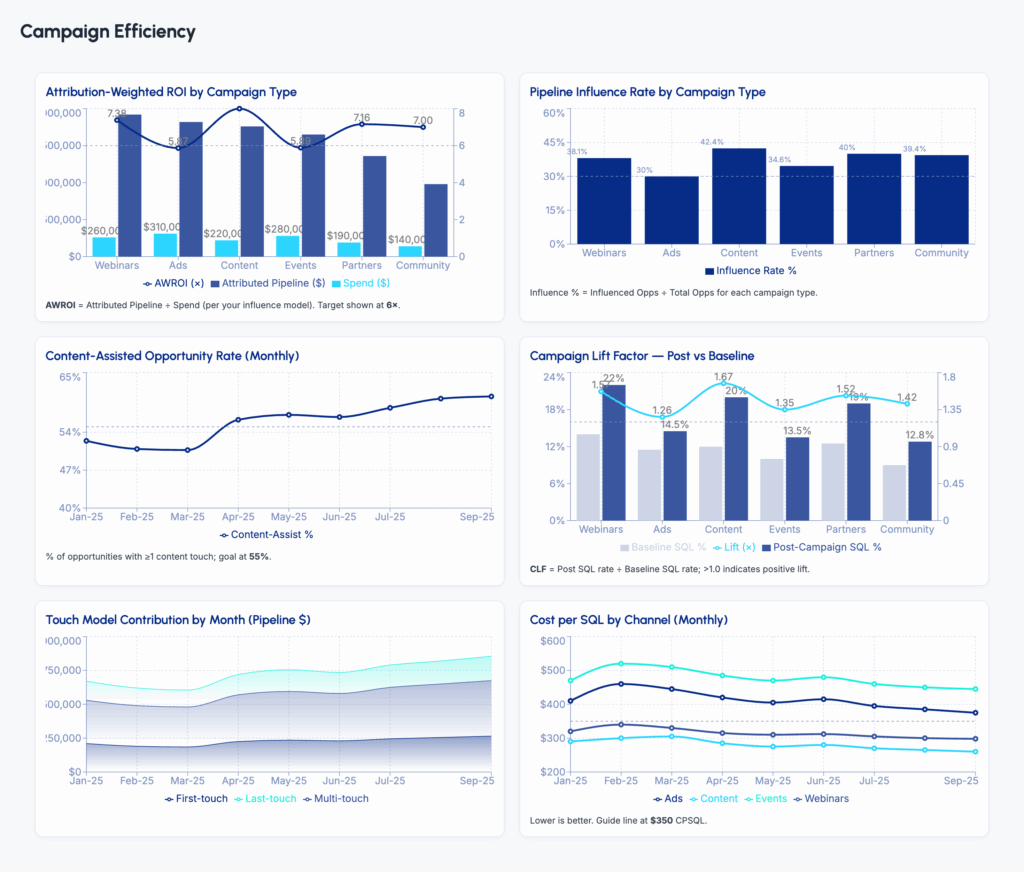
These indicators separate campaign vanity metrics from true revenue contribution. For example, if a campaign drives high engagement but <5% MQL conversion, Marketing reallocates budget toward higher-performing assets. The same model applies to first-touch ICP influence rates, multi-touch conversion probability, or content-assisted opportunity creation.

Implementation: Use Salesforce Campaign Influence or HubSpot Touchpoint Reporting to connect engagement with SQL and opportunity creation, moving toward a lifecycle-driven attribution model that ties campaigns directly to revenue. Set alerts for campaigns with strong engagement but weak pipeline impact. Enable dashboards for real-time budget allocation, ensuring spend shifts mid-quarter rather than post-mortem.

6. Customer Success Leading Indicators

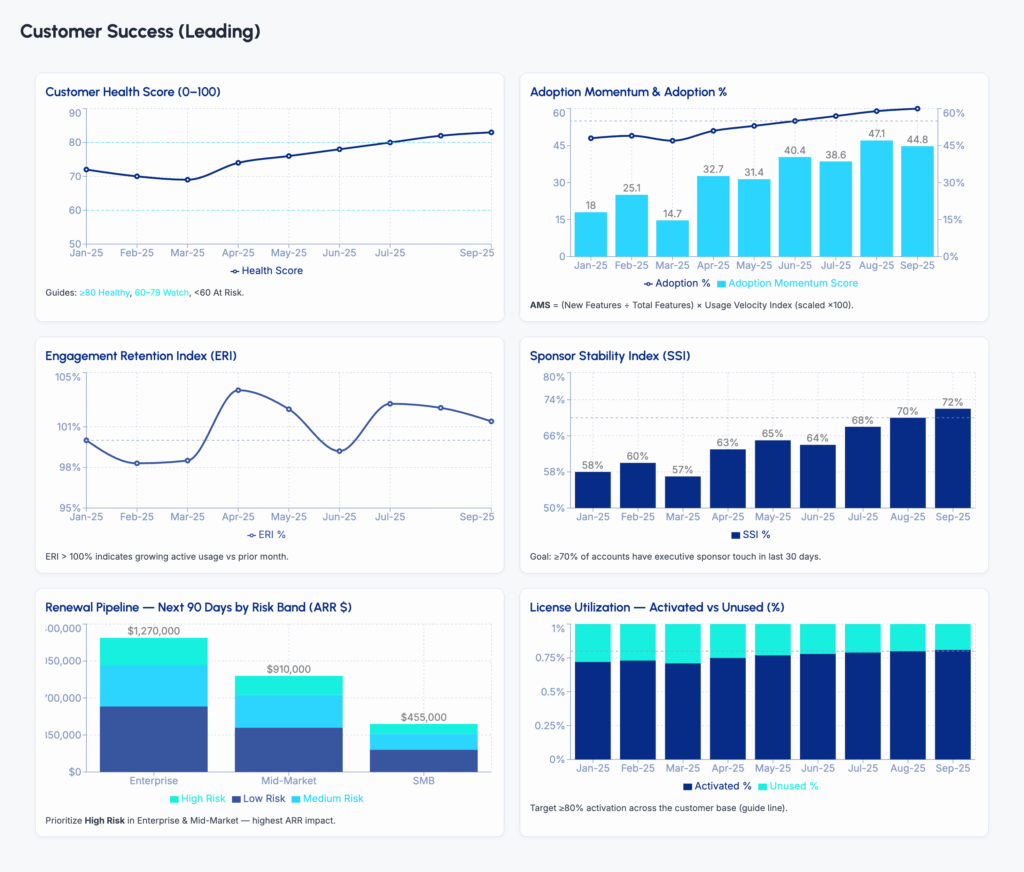
These indicators predict adoption and retention risk. For example, if customer health scores drop 10% in 30 days, CS initiates enablement sessions and exec alignment. The same model applies to unactivated licenses or missed QBRs.

Implementation: In Salesforce, calculate health scores with product usage and NPS data. In HubSpot, track adoption through customer health properties or CS integrations. Configure alerts for score declines or license gaps. Automate CS renewal playbooks when thresholds are breached. CS teams can also deploy behavioral trigger automation for PLG to identify early adoption risks and trigger re-engagement playbooks before accounts slip.

7. Post-Sale Account & Opportunity Risk Indicators

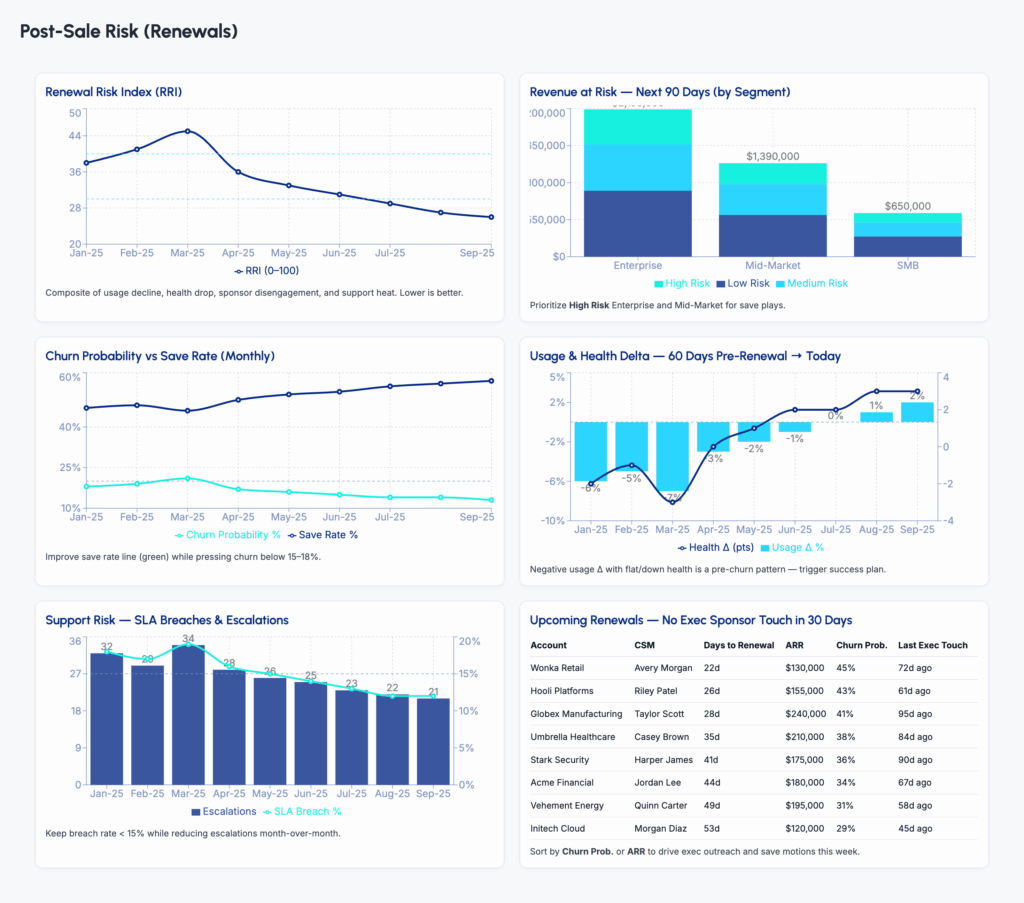
These indicators surface renewal risk before churn. For example, if product usage velocity drops 30 days before renewal, CS launches a re-engagement sequence with tailored support. The same model applies to unresolved ticket surges or sponsor disengagement.

Implementation: In Salesforce, integrate product usage and support data into account dashboards. In HubSpot, track health via custom properties or Service Hub ticket reporting. Configure alerts for usage dips or SLA breaches. Automate CS tasks and AE escalations when thresholds trigger.

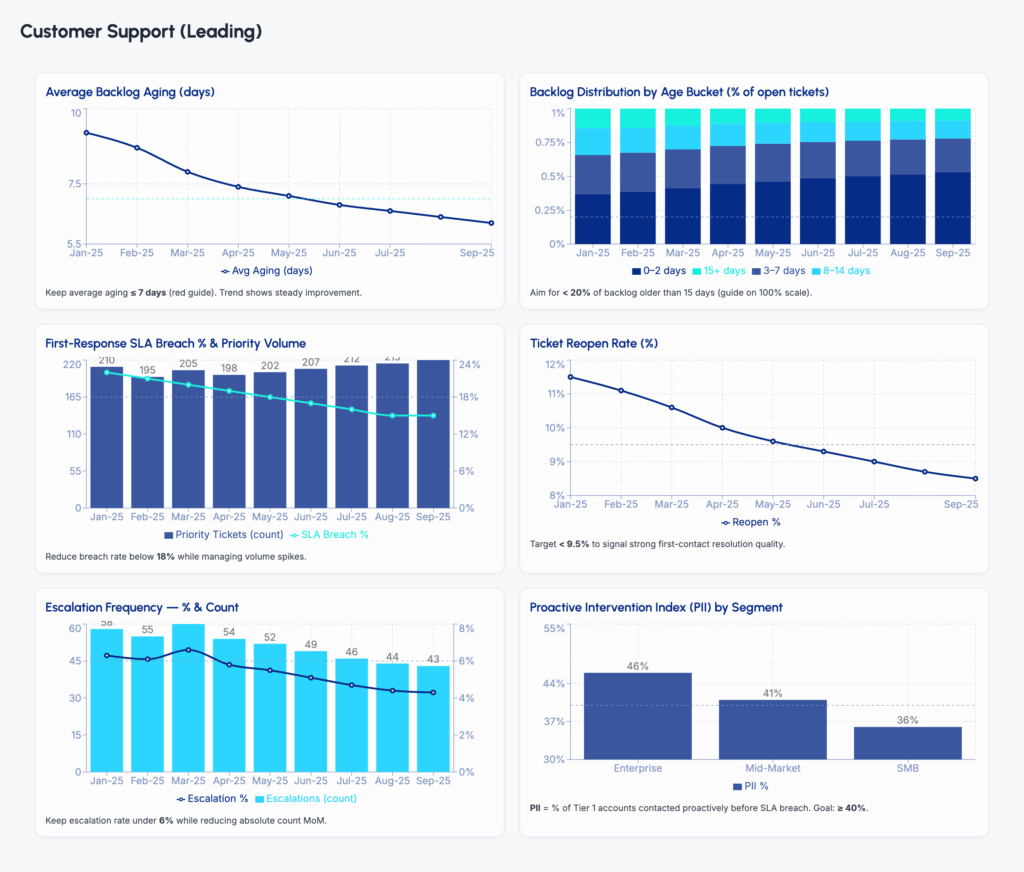
8. Customer Support Leading Indicators

These indicators expose dissatisfaction before churn. For example, if backlog aging exceeds 7 days on Tier 1 accounts, Support reallocates resources and initiates proactive outreach. The same model applies to SLA breaches, rising reopen rates, or escalation frequency.

Implementation: In Salesforce Service Cloud, monitor SLA dashboards and backlog reports. In HubSpot Service Hub, track ticket SLAs and reopen rates. Configure alerts for rising escalation metrics. Automate ticket routing and proactive outreach workflows to protect customer satisfaction.

Revenue Analytics 2.0 bridges that gap by embedding actionable insights, and intelligence directly into your go-to-market systems. RevOps Global helps sales, marketing, and operations teams to build this operational layer through our Revenue Analytics Playbook Implementation session. In this hands-on engagement, we’ll help you:

  • Identify and establish key leading indicators across functions, and systems
  • Set up real-time tracking, alerts and notifications in your systems
  • Create actionable dashboards and playbooks aligned with GTM motion
  • Build governance systems to ensure data accuracy and system trust

Book your Revenue Analytics Playbook Implementation session.

Revenue Analytics 2.0: The Shift from Lagging to Leading Indicators – Part 1

Most revenue teams have build their dashboards like post-race analysts: looking backward, measuring what already happened, and wondering why they missed their number. Pipeline coverage looked good last quarter. Attribution reports came in after the campaign closed. Sales reviewed performance after the deals were already lost.

Revenue Analytics 2.0 flips the script. It helps you shift from delayed dashboards to real-time, leading indicators that guide action before pipeline slips, not after.

This article will break down:

  • The difference between leading and lagging indicators (and why many teams get it wrong)
  • The five categories of leading indicators that drive GTM decision-making
  • How to build dashboards that enable faster, smarter action across marketing, sales, and customer success


Traditional revenue reporting lags behind the pace of modern GTM teams. It was designed for end-of-quarter summaries, not day-to-day decision-making.

  1. Siloed Systems Create Misaligned Metrics
    Marketing, sales, and customer success often rely on different tools for different things. For example, they use tools like HubSpot / Marketo for email engagement, Salesforce for pipeline tracking, Outreach / Apollo.io for outbound sales sequencing, Salesforce for Contact / Account / Opportunity Management, and many others for small day to day use cases. Each of these tools generates its own definitions of success. This lack of integration makes it nearly impossible to track buyer progression or campaign influence across the entire lifecycle.
  2. Lagging Indicators Can’t Drive Action
    Most reporting surfaces past outcomes like deals closed, records generated by source / channel, emails engagements, and campaigns completed. These metrics validate what happened but offer limited visibility into what’s likely to happen next. This leaves revenue teams stuck in diagnostic mode after the fact.
  3. Delayed Insight Slows Down the Entire GTM Engine
    When teams lack access to predictive signals, they fall out of sync. Marketing can’t optimize campaign spend mid-flight, sales can’t spot stalled deals early, and leadership can’t course-correct in time to hit the forecast. The cost isn’t just operational. It results in pipeline leakage and missed revenue targets across marketing, sales, customer success, and the broader GTM team.

To achieve Revenue Analytics 2.0, teams must start with a clear understanding of what they’re measuring and why, and build a modern, holistic revenue analytics engine around it.

AspectLagging IndicatorsLeading Indicators
NatureRetrospective – tell you what happened after the fact.Predictive – highlight where attention is needed before outcomes are locked.
PurposeValidate performance and support long-term planning.Surface early warning signs, momentum shifts, or conversion blockers while there’s still time to act.
Decision ImpactProvide no leverage for in-cycle decisions.Enable intervention while deals are still alive and buyers are still deciding.
Common Questions AnsweredHow many contact us form submissions happened?
Which marketing campaigns generated the highest engagement?
Which sales teams add the most activities or engaged accounts?
Where is buying committee engagement dropping?
Are demo follow-ups happening on time?
Are key metrics falling below baseline?
Examples• Records by Source & Channel
• Number of Activities logged by Sales Team across regions/segments
• Campaign-sourced MQL volume
• Pipeline created last quarter
• Pipeline Won / Loss review
• Demo Request / Meeting booked and follow-up SLA Monitoring
• Establishing buying groups on Opportunities
• Measuring Buying committee engagement dropping mid-funnel
• Meetings booked-to-SQL ratios falling below baseline
• High-intent leads engaging but not routed
• Pipeline velocity slowing in key segments / regions

Revenue teams need diagnostic visibility, i.e., metrics that surface friction, progression, or risk before outcomes are locked. We group these signals into five different categories:

  1. Funnel Progression Indicators
    • Description: These metrics track movement, velocity, and flow through your funnel.
    • Typical Use Cases: A RevOps leader notices slower MQL-to-SQL conversion in the enterprise segment. They adjust SDR outreach timing to speed up progression and protect pipeline velocity.
    • Metrics:
      • MQL-to-SQL conversion time by segment
      • % of opportunities with engaged buying group contacts
      • Pipeline coverage by region, persona, or product

  2. Engagement Quality Indicators
    • Description: These metrics measure whether the right people are engaging with the right content and whether that engagement signals buying intent.
    • Typical Use Cases: A Demand Gen manager sees strong engagement from ICP accounts in a new vertical. They double down on content and ads tailored to that segment to drive a more qualified pipeline.
    • Metrics:
      • ICP match rate on inbound leads
      • Content engagement score weighted by asset value
      • Buying committee engagement across channels

  3. Pre-Sale Account & Opportunity Risk Indicators
    • Description: Early warning signals that active opportunities are losing momentum or at risk before close.
    • Typical Use Cases: A Sales Ops lead notices that 40% of enterprise opps in the evaluation stage show no new stakeholder activity in 14 days. They trigger an exec sponsor outreach play to re-engage decision makers and revive stalled deals.
    • Metrics:
      • Decline in multi-contact engagement within open opps
      • No logged activity for X days on late-stage deals
      • Buying committee engagement score trending down mid-funnel
      • Competitor mentions rising in discovery/negotiation calls

  4. Account and Opportunity Risk Indicators (Post-Sale)
    • Description: These are early signals of churn, deal loss, or renewal risk. These indicators flag at-risk accounts before revenue is lost.
    • Typical Use Cases: A Customer Success manager sees reduced product usage from a renewal account. They trigger a save play with tailored support and sales follow-up before the renewal is lost.
    • Metrics:
      • Decline in multi-contact engagement
      • Drop in product usage velocity before renewal
      • Surge in unresolved support tickets tied to open opportunities

  5. Sales Activity-to-Outcome Indicators
    • Description: These metrics tie rep behavior to actual pipeline movement, revealing what’s productive, not just what’s busy.
    • Typical Use Cases: A Sales Ops lead spots a low meeting-to-SQL ratio for one team. They tweak outreach strategy and coach the reps to improve conversion from booked meetings to real opps.
    • Metrics:
      • Meetings booked-to-SQL ratio
      • Tiered outbound response rate (Tier 1 vs. Tier 3 accounts)
      • SLA compliance on MQL follow-up

  6. Campaign Efficiency Indicators
    • Description: These metrics show whether campaigns are driving real movement in the funnel. They bridge the gap between engagement and revenue contribution.
    • Typical Use Cases: A Marketing Ops lead compares campaign conversion rates and reallocates budget from low-impact webinars to high-performing case study assets that generate qualified opportunities.
    • Metrics:
      • First-touch influence rate on ICP accounts
      • Multi-touch conversion probability by campaign type
      • Content-assisted opportunity creation rate

  7. Customer Success Leading Indicators
    • Description: Predictive signals of adoption, engagement, or relationship health that impact retention and expansion.
    • Typical Use Cases: A Customer Success Manager sees that a renewal account’s health score has dipped due to falling feature adoption and sponsor disengagement. They trigger a save play involving enablement sessions and exec-to-exec alignment before renewal is at risk.
    • Metrics:
      • Decline in product usage velocity leading up to renewal
      • Executive sponsor no longer attending QBRs
      • % of licenses unactivated > baseline
      • Customer health score dropping 10%+ in 30 days

  8. Customer Support Leading Indicators
    • Description: Metrics that surface friction or dissatisfaction in support interactions before it impacts CSAT or churn.
    • Typical Use Cases: A Support manager sees backlog aging spike for Tier 1 accounts. They reallocate resources and spin up a proactive outreach plan to reduce escalations and protect customer experience.
    • Metrics:
      • First-response SLA breaches rising on priority tickets
      • Ticket reopen rate trending above baseline
      • Escalation frequency increasing on key accounts
      • Backlog aging >7 days even at steady volume

Leading indicators drive action. Lagging indicators measure results. A high-performing revenue engine requires both and the ability to move between them with precision.

Dashboards that focus only on lagging metrics can’t guide in-quarter execution. On the other hand, teams that ignore historical outcomes lose sight of what actually works. The solution is to connect the two across the entire customer lifecycle.

This is where advanced models for processes like marketing attribution, opportunity management, and customer lifecycle analytics become critical. Attribution models connect revenue back to the campaigns and touchpoints that drove it, while lifecycle analytics reveal how buyers progress or stall, at each stage of the journey.

When combined with real-time leading indicators, these models create a unified reporting layer that supports both daily execution and quarterly planning.


Most companies already have the data they need. But it’s buried under dashboards overloaded with lagging metrics. Pipeline slippage, engagement drop-offs, content value trends, and buying signals often sit hidden across Salesforce, HubSpot, and other RevOps tools. Without surfacing these leading indicators, teams are left steering with the rearview mirror.

In Revenue Analytics 2.0 Playbook: Operationalizing Leading Indicators – Part 2, we establish the framework, and share playbook examples for each of the revenue analytics categories.


RevOps Global offers Revenue Analytics Indicator Audit to initiate your transition process. The audit is designed to expose the signals your current dashboards miss and connect them back to real-time GTM execution. We’ll take a deep dive into your existing dashboards and revenue processes to:

  • Identify high-impact leading indicators you’re missing
  • Uncover cross-object blind spots in your Revenue Operations Tech Stack
  • Benchmark your reporting stack against RevOps Global frameworks
  • Recommend actions you can take in the next 30 / 60 / 90 days

Whether you’re a VP of RevOps building lifecycle governance, a Demand Gen lead optimizing campaign performance, or a Sales Ops manager trying to reduce deal risk—this audit will give you the visibility you need to lead, not just report.

Schedule a 1:1 to learn more about Revenue Analytics 2.0 audit.

HubSpot Attribution Views: A RevOps Leader’s Guide

Revenue conversations often break down at attribution. Marketing highlights campaign ROI. Sales questions lead quality. Finance doubts the numbers. Leadership loses confidence in the funnel altogether.

Usually, data is scattered, configured differently, or presented in ways no one fully believes, leaving every team with a different version of “what’s working.”

The fix: build attribution views in HubSpot that actually answer business questions. Consequently, they enable faster decisions, cleaner reporting, and cross-team alignment on what’s truly driving revenue. Here’s a proven, RevOps-tested framework to make that happen.


HubSpot attribution reporting is powerful. But that’s only if you respect its boundaries. It handles multi-touch attribution well, offering models like first touch, last touch, linear, and U-shaped. It also ties attribution directly to deals rather than just contacts, and it can break down contribution by channel, campaign, and even content level.   

But it isn’t perfect. It can’t track anonymous touches such as paid impressions that happen before a form fill. It also won’t retroactively assign attribution for deals created before contact association. And it’s not a replacement for Salesforce campaign influence models in hybrid stacks.

HubSpot cannot match Salesforce campaign influence 1:1. But with proper HubSpot RevOps reporting setup and deal-based attribution, you can achieve reliable pipeline insights without needing two attribution systems.


Attribution is a decision tool, not a reporting checkbox. So, start by defining what you need to decide.

Questions to clarify:

  • Which channels generate MQLs that become opportunities fastest?
  • Which campaigns or content influence high-velocity deals?
  • Are paid programs contributing real pipeline, or just volume?

Pick a model based on the question:

  • First Touch: Compare channels driving net-new leads.
  • U-Shaped: Understand marketing influence across early and mid-funnel.
  • Last Touch: Optimize deal acceleration and conversion triggers.

But do you need multiple models? Sometimes. Comparing models for the same dataset helps validate assumptions before making budget or strategy decisions.


HubSpot attribution is only as clean as your contact to deal association HubSpot setup.

Define when contacts should be auto-associated with deals, how lifecycle stages map to attribution checkpoints, like SQL = opp creation, and what happens when contacts are created after a deal already exists.

Use automation to enforce consistency. Why? Because if contacts aren’t linked before the deal is created, attribution breaks downstream.

Pro tip: Manual association is usually not safe. Manual steps create gaps. Thus, automated association using workflows or rules should be standard in every RevOps system’s design.


Building reliable HubSpot attribution reporting requires intentional setup.

Checklist:

  • Pick the right conversion point, like deal creation or closed-won, not arbitrary dates.
  • Use deal-based, not contact-based, attribution for revenue analysis.
  • Filter by pipeline, lifecycle stage, or channel to segment insights cleanly.
  • Validate logic against expectations. For example, paid search should not show zero influence if active campaigns exist.

Different teams need different views. So, one generic dashboard won’t build trust.

For demand gen:

  • Which campaigns contribute most to SQL creation?
  • Which channels are most cost-efficient?

For sales:

  • Which programs warm deals pre-opportunity?
  • Are MQLs actually converting?

For leadership:

  • What % of the pipeline is marketing-influenced?
  • How does ROI distribute across paid, organic, and partner sources?

Also, build filtered HubSpot campaign attribution dashboards per audience, clear, role-based, and actionable.

This way, make sure everyone sees the same data. The same truth, yes. But in different lenses. The right view builds trust without overwhelming teams with irrelevant metrics.


Even the best dashboards fail without ongoing quality control.

Run monthly checks:

  • Confirm UTMs are being captured consistently.
  • Audit deals for missing contact associations.
  • Review lifecycle progression before opportunity creation.
  • Flag anomalies where attribution logic doesn’t align with expected channel impact.

Besides this, can attribution QA be automated? Yes, but partially. Alerts for missing associations or blank source data can be built into HubSpot workflows. However, human review still catches what automation misses.


When attribution works, budget fights disappear, GTM alignment accelerates, and leadership trusts RevOps as the single source of revenue truth.

So, you need a disciplined setup of HubSpot attribution reporting, proper contact-to-deal association, and role-specific attribution views.

Ready to fix your attribution issues?
We help B2B teams turn messy HubSpot data into decision-ready attribution dashboards. If your reports cause more arguments than insights, let’s design the framework, clean the logic, and give your GTM teams attribution they can finally trust. Book a 1:1 strategy session with us right away!

What Does a Marketing Automation Agency Do

It’s 8:47 AM and your GTM team’s “quick sync” has already gone off the rails. Marketing claims the webinar brought in 300 leads. Sales hasn’t seen any of them. The CRM is filled with duplicates. No one knows which campaign influenced which opportunity. Your board deck is due in 48 hours, and you still don’t have clear answers on what’s driving your pipeline.

You have the tools—Salesforce, Marketo, HubSpot, and more. But without alignment, automation, or clear insights, they’re not driving results.

This is where a Marketing Automation Agency can step in and transform your processes. Specialists from these agencies reengineer your systems, processes, and integrations.

In this article, we’ll discuss what a marketing automation agency does and how it helps GTM teams move fast. 


A Marketing Automation Agency helps your teams use the right tech in order to streamline, scale, and measure their marketing efforts. Apart from setting up the tools., they also make sure that your sales and marketing teams work together to support your revenue goals.

  • Design automation workflows that nurture leads, trigger sales alerts, and move prospects through the funnel
  • Integrate platforms like Marketo, HubSpot, Salesforce, and attribution tools so your data flows cleanly and consistently
  • Optimize campaigns so they’re targeted, scalable, and measurable
  • Build reports and dashboards that show what’s working—and what’s not

Every RevOps or Marketing leader has been there. You invest in the right tools, build the right team, and still something’s not working. 

Here’s how a marketing automation agency can help solve these issues and help your GTM motion scale.

Many businesses buy powerful tools but only scratch the surface of their functionality. An automation agency brings to the table detailed platform assessments and customized training. They also help you use advanced functionality like lead scoring, intent-based triggers, lifecycle automation, and more.

It happens a lot that when you don’t have a shared understanding or when you have manual workflows, valuable leads slip away. An agency designs tailored lead nurturing sequences and automated hand-off processes. 

A lot of marketing teams still spend a huge amount of time on repetitive tasks that further lead to inefficiencies and lower strategic output. Agencies automate tasks like email follow-ups, list segmentation, and campaign management. This helps teams spend their valuable time more strategically. 

We often see sync errors while integrating Salesforce and marketing automation tools. This further leads to inaccurate reporting and lost opportunities. Agency marketing automation addresses these complex integration challenges by ensuring smooth synchronization and data consistency. 

When you have inaccurate, duplicate, or fragmented data, it significantly impacts marketing efficiency and decision-making accuracy. Agencies apply rigorous RevOps governance, standardize fields, and maintain data hygiene. 

Marketing automation agencies build attribution models, fix UTMs, and set up dashboards that actually reflect influence, not just last-touch.


You might think that engaging with a marketing automation agency is all about outsourcing technical tasks to an expert. However, that’s not it. These agencies bring broad expertise across various platforms like Salesforce, Marketo, HubSpot, and Pardot, as well as specialized knowledge in integrations and process optimization.

These years of experience allows them to quickly identify inefficiencies in your system and apply proven solutions, helping you see faster results. For example, marketing automation tools like HubSpot or Marketo can help automate workflows and optimize campaigns, but they need to be fully integrated with your CRM to provide the best results.


Most RevOps teams today have an execution gap. Agencies close that gap by solving issues that kill speed, accuracy, and revenue. So, answer these questions:

  • Is your team is buried in manual processes?
  • Are your leads are slipping through?
  • Is your reporting unable to answer simple ROI questions?

If you answered “YES” to any of the above questions, it’s time to bring in specialists who can fix it at the system level.
Book a demo to see how we design automation systems that fix lead flow, clean up reporting, and turn your marketing ops into a revenue engine.

What Scalable RevOps Architecture Actually Looks Like

While your team is trying to untangle spreadsheets, Slack pings, and misaligned reports, someone else’s revenue is quietly getting faster, cleaner, and built to scale.

That’s the danger of waiting. Broken systems make growth harder, more expensive, and less predictable. The organizations that win are the ones that fix their architecture before they’re forced to.

Here’s what a scalable RevOps architecture really looks like and how building it right now can save you months of pain later.


Every scalable RevOps architecture starts by assigning clear roles to each system. No more debating where to put lifecycle data, campaign attribution, or deal tracking.

  • CRM (Salesforce): The single source of truth for accounts, contacts, pipeline, and forecasting.
  • MAP (HubSpot, Marketo, Eloqua): The engine for capturing, nurturing, scoring, and attribution.
  • Data Layer: ETL or middleware (Segment, Workato, Hightouch) for syncing and business logic.
  • BI / Reporting Layer: Tableau, Looker, or native CRM reporting for leadership-ready dashboards.

But can HubSpot and Salesforce work together reliably? Yes. But only if you follow HubSpot Salesforce integration best practices. That means consistent field mapping, conflict resolution rules, and sync monitoring as part of your RevOps systems design.


Without governance, scale equals chaos. If every department edits fields or lifecycle logic, data trust evaporates.

A scalable architecture defines:

  • Field Dictionary: What every field means, who owns it, where it syncs.
  • Lifecycle Governance: Documented rules for MQL, SQL, Opportunity, Customer stages.
  • Access Controls: Who can edit what, in which platform, and under what conditions.

Pro tip: You need governance early. Otherwise, you’re likely to rip out bad data models under pressure. Whereas early governance is cheaper, faster, and protects your future reporting.


Instead of one giant “if-this-then-that” automation, build modular Hubspot workflows, having trigger-based sequences for scoring, routing, or notifying, centralized “router” programs to control where leads or accounts go next, and guardrails to stop loops and prevent overwriting valuable data.

This approach is faster to debug, easier to scale, and safer when onboarding new teams or products. Even for smaller teams, modular design isn’t overkill. Rather, it keeps small systems from breaking when you double headcount or add new markets. Scalable now = stable later.


A modern RevOps tech stack is only as good as the story its data can tell.

Your reporting layer must reconcile metrics across systems, map funnel movement across marketing, sales, and customer success, attribute campaigns to revenue with confidence, and monitor SLA compliance and lead velocity across regions and teams.

Standard dashboards include:

  • Lifecycle Funnel: Volume and conversion rates.
  • Multi-System Funnel Reporting: CS + marketing + sales alignment in one view.
  • Source Attribution: Which campaigns actually influenced the pipeline.
  • SLA Compliance: Follow-up speed by rep, region, or channel.

You can finally trust campaign ROI numbers, but only when attribution models are unified and data logic is consistent across every system in your RevOps stack.


Scalable doesn’t mean rigid. The best RevOps systems evolve without breaking.

That means building for safe iteration:

  • Change request workflows for fields, scoring, routing, and dashboards.
  • Version control for workflows and scoring logic.
  • Sandbox testing before pushing updates live.
  • Documentation every GTM team can access (and actually trust).

Pro tip: You can’t eliminate “shadow ops” (people making edits outside the process) entirely. But a clear request-and-approval framework plus transparent documentation makes off-the-record changes unnecessary.


A scalable RevOps architecture assigns clear system roles, enforces lifecycle governance, and uses modular workflows instead of fragile automation chains. Reporting aligns marketing, sales, and CS with unified attribution and SLA tracking. Change management keeps growth safe with version control, testing, and documentation. 

Together, you get a RevOps systems design that scales reliably, supports cross-team trust, and turns data into strategy. No endless rework or integration issues.

Need to build a scalable RevOps architecture right the first time? Our HubSpot RevOps consulting team designs scalable RevOps architecture and complete RevOps systems design frameworks for B2B companies that want growth without chaos. 

Let’s build the system your competitors wish they had. Book your RevOps consult today!

Attribution Stack Audit: A 5-Part Framework for RevOps Teams

When attribution breaks, so does decision-making. Marketing swears by last touch. Sales claims outbound created the deal. Finance questions why the numbers never line up in board decks. 

All of this happens because your attribution stack was never designed to agree in the first place.

But an attribution stack audit can solve this! A structured review of your fields, syncs, logic, reporting, and stakeholder alignment, when done right, turns attribution from a political liability into a B2B attribution framework that eventually makes budgeting clearer and campaign influence debates disappear. 

This blog explores 5 key steps for attribution stack audit so that RevOps gets recognized as the source of truth.


Field clarity. That’s your first step. If you don’t know which fields feed attribution or who owns them, every dashboard is suspect.

  • Where is each field populated: form, API, or manual entry?
  • Who owns the field logic: RevOps, MOPs, or sales ops?
  • Which fields are editable, and which must stay locked?

Pro tip: One of the best RevOps attribution best practices is to lock down UTM and campaign ID fields to prevent sales or SDR edits that corrupt source tracking. This avoids misattribution at the deal level.


Attribution fails less because of fields and more because of how they move. A HubSpot Salesforce attribution sync is notorious for losing UTM values mid-transfer or overwriting campaign data with blanks.

This step is about creating a data flow map:

  • Define the sync direction (one-way vs. bidirectional).
  • Mark where delays or overwrites occur.
  • Annotate ownership zones so each team knows where responsibility begins and ends.

Remember, delays of even a few minutes can wipe UTM values if leads get pushed to Salesforce before MAP capture finishes. That’s why documenting sync timing is critical.


Clean fields won’t help if your model logic is flawed. This part of the B2B attribution framework ensures every stakeholder is looking at attribution the same way.

Ask yourself:

  • Does your CRM rely on campaign influence or custom rollups?
  • Are form UTMs consistently passed to opportunities?
  • Do you account for both anonymous and known touches?

But what’s the biggest misalignment RevOps teams face? It’s whether to use multi-touch or single-touch. The safe play: build for multi-touch attribution alignment, even if leadership prefers simpler models because reality is rarely single-touch.


Even when the data and logic are sound, dashboards can break alignment. So, your RevOps dashboard strategy must reflect the attribution framework, or reporting credibility collapses.

Check for:

  • Filters that exclude lifecycle stages or deal types
  • Attribution grouped by “lead source” instead of campaign ID
  • Timeframe mismatches between campaign and opportunity dates

Pro tip: If your HubSpot report and Salesforce report show different attribution numbers, don’t panic. It’s usually a filter misalignment, not a data failure. Running the same logic across platforms is a quick validation tactic.


Attribution is a tech problem that’s also a people problem. If stakeholders don’t know what the model is or which platform owns the reporting truth, your campaign influence audit will never stick.

Key checks here:

  • Do teams know whether you’re using first, last, or W-shaped models?
  • Is there a shared definition of what each field means?
  • Is reporting ownership clear across RevOps, sales ops, and marketing ops?

Remember, you don’t need perfection. The real goal is alignment. A model everyone understands is better than three competing models across departments.


By the end of this attribution stack audit, RevOps leaders should be able to say with confidence:

  • Which attribution data is reliable and why
  • How dashboards are powered, and which are reporting-ready
  • What must be fixed before using attribution for budget or resource planning

The biggest shift is attribution moves to a transparent, defensible process that drives trust across marketing, sales, and finance.


Ready to turn attribution chaos into clarity? Book your attribution stack audit today. We’ll uncover gaps, rebuild trust in your data, and give RevOps the authority it must have

Prevent MAP to Salesforce Sync Issues: A RevOps Survival Guide

Every RevOps team has lived through it: 

– Salesforce says a lead belongs to Sales. 

– HubSpot disagrees. 

– Marketo refuses to sync. 

– And suddenly, the attribution dashboard is missing half the data the board is expecting.

That’s the direct result of MAP to Salesforce sync issues. These failures waste hours in cleanup, cause Sales to doubt Marketing’s numbers, and fracture RevOps credibility.

But MAP to Salesforce sync issues aren’t random. They follow patterns. But when you apply the right RevOps sync governance, you can prevent the misalignments that derail pipeline visibility and campaign performance.

This guide breaks down why MAP to Salesforce sync issues happen, how to fix the failure points, and what it takes to scale MAP-to-CRM integrations without losing data integrity.


MAP to Salesforce sync issues rarely happen from one big mistake. They’re usually small cracks in the integration setup that compound over time.

  • Field mismatches: A MAP stores a field as text, while Salesforce expects a picklist.
  • Overwrites: Bidirectional syncs allow both systems to update the same field.
  • Permission gaps: Integration users lack access to record types or fields.
  • Volume overload: Bulk imports spike API calls and cause silent failures.
  • Logic conflicts: Lifecycle rules or lead scoring triggers don’t align.

Having said that, MAP to Salesforce sync issues can still happen even if the integration worked fine before. But why? Because MAPs like HubSpot or Marketo evolve. New fields, workflows, or picklists get added without updating the Salesforce mapping. So, what was working yesterday breaks quietly tomorrow.


Fixing MAP to Salesforce sync issues involves hardening governance, normalizing data, and monitoring proactively. This way, RevOps leaders can build a sync that scales without collapsing under pressure. Here’s how to get it right:

Step 1: Build a Field-Level Governance Model

The foundation of clean data is clarity on who owns which field. That’s where CRM field mapping strategy comes in.

  • Define the System of Truth per field (for example, lead status = Salesforce).
  • Decide which fields should sync one-way vs. bidirectional.
  • Enforce picklist validation and required values.
  • Document everything in a RevOps sync governance matrix.

Step 2: Harden Your Integration User Setup

One overlooked cause of HubSpot Salesforce integration errors or Marketo sync failure is the integration user itself. Still, many teams connect using a personal Salesforce account.

The better approach:

  • Create a dedicated integration user.
  • Grant full read/write access to all mapped fields and campaign objects.
  • Test permissions in a sandbox before connecting to production.

However, you don’t always need full admin access for sync. But the integration user should have unrestricted access to any field that syncs. Limited permissions cause hidden, partial sync failures that are harder to detect.

Step 3: Normalize Picklists and Field Types

Picklist mismatches remain the most common root cause of sync errors.

To prevent issues:

  • Align MAP dropdowns with Salesforce picklist values.
  • Automate defaults when values are blank.
  • Avoid mapping free-text fields to Salesforce picklists unless normalized upstream.

Pro tip: You shouldn’t let MAP free-text feed into Salesforce if it requires strict picklists. That’s how syncs fail silently. So, normalize at the MAP level before sending data downstream.

Step 4: Control Lifecycle + Ownership Rules

Lead lifecycle, ownership, and status fields often get caught in MAP-to-CRM conflicts.

The fix:

  • Assign one system to own lifecycle updates.
  • Assign the other to control lead status.
  • Use conditional logic to prevent overrides.
  • Apply field stamps so teams can trace the last update source.

But ownership fields break most often? That happens because sales, marketing, and automation workflows all try to update them. Without strict rules, one update cancels another, leaving leads ownerless.

Step 5: Monitor Sync Health Proactively

Prevention is cheaper than repair. That’s where RevOps integration best practices come in.

  • Track error logs in MAP activity logs.
  • Audit “leads with blank owner or lifecycle” weekly.
  • Review bulk uploads before syncing.
  • Add recurring sync health checks to your RevOps calendar.

Pro tip: You should audit sync health at least weekly and daily if you run heavy campaigns or frequent bulk imports.

Step 6: Build a Sync Exception Tracker

Create a centralized tracker for:

  • Records that failed to sync
  • Blank required fields
  • Overwritten key values

This makes systemic problems visible before they ripple into reporting or attribution.


MAP to Salesforce sync issues are governance problems. Setting field ownership, normalizing data types, strengthening integration users, and auditing sync health help RevOps teams stop firefighting and build integrations that scale with confidence.

Instead of spending hours in cleanup, your team can spend time on building the campaigns, dashboards, and revenue motions that drive real impact.

Are MAP to Salesforce sync issues costing you pipeline trust? Let’s talk about how to harden your MAP-to-CRM architecture before the next reporting cycle exposes gaps.

Campaign Quality Assurance to Ensure Accuracy at Scale

Every growth team knows the pain: you’ve got a Marketo nurture, a HubSpot landing page, Salesforce campaigns, and a dozen UTMs… and something always slips. 

  • A missing sync breaks attribution
  • A wrong segment frustrates sales
  • A skipped test email lands in spam

The solution is to create a centralized Campaign QA Process that works across platforms. With a structured approach, RevOps can decrease costly errors, keep attribution clean, and rebuild confidence between marketing and sales.

The impact: Campaigns launch faster, data flows correctly, and sales don’t lose trust in marketing just because “another lead went missing.”


The problem of chaotic campaign QA is common. RevOps teams often ask: “Whose job is it to QA this?” But no one owns it fully.

Here’s where it fails most often:

  • No unified QA checklist. Marketers check the creative part. Ops checks syncs. But nobody validates end-to-end.
  • Last-minute launches. QA is squeezed into an hour before go-live.
  • Platform silos. A Marketo program looks fine. But HubSpot forms aren’t passing UTMs. Or Salesforce campaigns don’t capture members.
  • No accountability. Everyone assumes someone else handled it.

So, do we need a QA checklist even if we already test emails? Yes. Email testing alone isn’t enough. Your Marketo QA Checklist or HubSpot QA must also include routing, attribution, and lifecycle triggers, not just visuals.


QA involves protecting attribution, routing, and reporting. This makes sales trust your data. A strong multi-platform campaign testing framework should always cover:

  • Segmentation logic (are the right people targeted?)
  • UTM and source tagging (is attribution intact?)
  • CRM campaign sync (is Salesforce Campaign QA clean?)
  • Routing (are leads assigned to the right reps?)
  • Lifecycle paths (does scoring and stage progression work?)

But can’t we just fix it later in Salesforce reports? Not really. Once data is lost at source, reports can’t recover it. Prevention beats repair every time.


1. Start With a Master QA Checklist

Create a template that’s platform-agnostic. Then, add specifics:

  • Marketo QA Checklist → triggers, program statuses
  • HubSpot Campaign Testing → list filters, hidden fields, workflows
  • Salesforce Campaign QA → member sync, campaign ID, attribution fields

This keeps teams aligned, no matter the platform.

2. Define Ownership Clearly

A RevOps campaign launch framework works best when ownership is shared but defined:

  • Marketing Ops owns campaign logic and testing.
  • Sales Ops owns routing and rep notifications.
  • Demand Gen owns segmentation and UTMs.

Everyone signs off before launch. And who actually clicks the test links? Usually MOPs. But demand gen should validate content relevance while ops validates flows.

3. Test With Real Scenarios

Don’t rely on “[email protected].” Use test leads that reflect lifecycle stages:

  • A new lead entering nurture
  • An MQL routing to SDR
  • An SQL syncing to pipeline

Testing real-world flows ensures you don’t miss how campaigns impact sales.

4. Embed QA Checkpoints in Project Plans

QA should be a process, thus including:

  • Pre-launch check
  • Post-launch validation
  • Week 1 attribution audit

But do you need QA after launch? Yes. Post-launch QA catches sync errors and routing failures that don’t appear immediately.

5. Audit Routinely, Not Just at Launch

Monthly audits reveal:

Routine audits prevent systemic errors, instead of chasing fixes at quarter-end.


  • Master Campaign QA Process template (shared across teams)
  • Platform-specific sub-checklists (Marketo, HubSpot, Salesforce)
  • Clear ownership model (MOPs, Sales Ops, Demand Gen)
  • End-to-end test scenarios with real personas
  • QA checkpoints built into project timelines
  • Ongoing audits beyond campaign launch

A centralized, RevOps-driven process ensures every launch, be it in Marketo, HubSpot, or Salesforce, protects attribution and keeps sales trust intact.

If your team struggles with broken UTMs, missed routing, or Salesforce campaigns that don’t reflect reality, you need to upgrade your QA.


Let’s build a RevOps campaign launch framework that scales. Book a consultation today, and we’ll help you create a campaign QA process that eliminates chaos, protects reporting, and speeds up growth.

Marketo Cleanup Strategy That Protects Reporting Integrity

Your Marketo instance shouldn’t feel full of forgotten campaigns, untagged assets, and mysterious programs that “might still be doing something important.” Yet, that’s the reality for many marketing teams.

Deleting the wrong smart campaign can break lead scoring, wipe out historical attribution, or disrupt Salesforce syncing. So instead of cleaning up, teams just… stop touching anything. The result? Slower campaign performance, cluttered workspaces, and reporting riddled with outdated data.

The fix isn’t just “delete old stuff.” A reliable Marketo cleanup strategy protects your Marketo reporting integrity while streamlining day-to-day operations. When Marketo cleanup strategy is done right, cleanup removes noise, keeps attribution intact, and creates a sustainable foundation for future campaigns.

Here’s how to clean up without breaking a single report and why governance makes all the difference.


Cleanup projects often stall because no one wants to be the one who breaks something that sales or leadership still uses.

The solution: Start by surfacing why past cleanups failed. In most cases:

– Attribution fears: Revenue Explorer, multi-touch attribution, or Salesforce campaign syncs depend on programs with no clear documentation.
– Hidden dependencies: Smart campaigns reference lists or flows from years ago.
– Orphaned assets: Programs created for one-off events still influence scoring or reporting.
– Legacy logic: Old filters like “Member of List X” survive long after that list stopped updating.

Impact: When you understand exactly why teams hesitate, you can design a Marketo asset audit that removes fear from the process.


Step 1: Create a Cleanup Candidate Tracker

You can’t clean what you can’t see. Start with a centralized list of all assets, like programs, forms, smart campaigns, static lists, and landing pages. Flag those that:

Tools like Campaign Inspector, Smart List filters, and consistent naming conventions speed up this discovery. But should you delete inactive assets right away? No; this is where Marketo program archiving comes in. Archive first, delete later.

Step 2: Archive, Don’t Delete

Archiving reduces clutter without killing history. Create a clear “\_Archive” folder structure so everyone knows what’s safe to ignore but still accessible for reporting. 

  • Keeps historical data intact for attribution
  • Prevents accidental deletion of reporting-linked programs
  • Allows easy recovery if something breaks

Also, don’t bulk-delete based on “last updated” alone. Some campaigns run on autopilot.

Pro tip: Keep assets archived before deletion for at least two reporting cycles, often 1–2 quarters.

Step 3: Map Reporting Dependencies

This is where a reliable Marketo agency protects Marketo reporting integrity. Build a map showing which programs, fields, and campaigns feed each critical report. Include:

  • Lifecycle triggers
  • Attribution campaign IDs
  • Lead scoring logic
  • Salesforce sync programs

Documenting dependencies also strengthens your RevOps Marketo maintenance process by making it easier for new team members to understand the reporting chain.

Step 4: Implement Campaign Governance

Without a governance model, clutter creeps back within months. Lock in:

  • Naming conventions, like `2025-Q2-NA-Webinar-Topic`
  • Program tags, like Region, Stage, and Channel
  • Cloneable templates for nurture, events, webinars, etc.

Clear Marketo campaign governance ensures every new asset is easy to find, manage, and eventually retire.

Step 5: Make Cleanup Ongoing

A one-time cleanup only delays the next mess. Add Marketo program archiving and audits to your quarterly RevOps workflow:

Pro tip: Combine quarterly audits with other platform maintenance. For example, pair them with CRM sync checks or lead routing reviews for maximum efficiency.


A clean Marketo is a direct boost to campaign performance, reporting accuracy, and team confidence. Tracking assets, archiving before deleting, mapping dependencies, enforcing governance, and making cleanup routine help you remove the fear of “breaking something” for good. The payoff: Faster execution, clearer insights, and a marketing engine that stays ready for growth instead of drowning in digital clutter.

Ready to clean up your Marketo without breaking reporting? Let’s build a governance-backed strategy that keeps attribution intact and campaigns running smoothly. Get in touch with us today!

HubSpot SLA Enforcement: Drive Follow-Up Without Chaos

You’ve set the rules. Marketing Qualified Leads get a follow-up in 24 hours. Sales Qualified Leads get action within 48. You’ve got buy-in from leadership, and sales nodded along in the kickoff call.

But a few months later, follow-ups are slipping. Dashboards don’t add up. And your HubSpot instance is cluttered with timestamp hacks and messy logic.

HubSpot SLA enforcement shouldn’t require a maze of workflows to get right. When done wrong, it leads to alert fatigue, inconsistent data, and zero accountability.

When done right, it drives faster follow-up, tighter handoffs, and clear performance metrics, without breaking your portal in the process.


The biggest challenge is defining the SLA and keeping the system reliable.

Teams often:

  • Over-engineer workflows to cover every “what if” scenario.
  • Build HubSpot SLA workflows that constantly reset timestamps or trigger false alerts.
  • Forget to align definitions between marketing, sales, and RevOps.

But can’t you just add a reminder email when an MQL is assigned? Yes. But that’s reactive, not enforcement. Without timestamps and breach flags, you can’t measure compliance or hold teams accountable.


Follow the below five steps to enforce SLA in HubSpot.


Step 1: Define Your SLA Triggers with Precision

SLA enforcement starts with knowing exactly when the clock starts. For HubSpot MQL follow-up, that might be when:

  • Lead score crosses the MQL threshold.
  • A form submission indicates sales intent.

For SQL follow-up, it might be when the lifecycle changes to SQL or a deal is created. Be precise. Ambiguity here leads to misreported SLAs later.

Pro tip: Separate triggers for inbound and outbound leads if the follow-up timeframes differ. Otherwise, you risk skewed compliance rates.

Step 2: Track SLA Windows with Date Properties

Create dedicated date/time properties like:

  • MQL Date
  • SQL Assigned Date
  • First Sales Activity Date

Populate them once via workflows so they don’t overwrite and create messy histories. This also powers your HubSpot RevOps automation for breach detection and reporting. But why not use the built-in “became an MQL” date? You can. But custom properties give you more control and prevent accidental resets.

Step 3: Use Breach Flags for Measurable Compliance

Set boolean fields such as:

  • MQL SLA Breached?
  • SQL SLA Breached?

Then, build a single daily evaluation workflow that checks the date properties and flags records where the SLA window is missed. This approach works well for HubSpot lead routing SLAs, because breach flags can also trigger escalations or rerouting without adding dozens of workflows.

Step 4: Alert with Intent, Not Noise

Instead of flooding inboxes with every violation:

  • Notify the record owner only when their lead breaches.
  • Escalate to managers if breach counts cross a set threshold.
  • Create follow-up tasks directly in HubSpot.

For operational visibility, tie this into sales follow-up dashboards so managers can review patterns in team meetings, not just react to pings.

Step 5: Build Dashboards that Drive Behavior

Numbers matter. But HubSpot workflow strategy is wasted without visibility. Your Hubspot dashboards should show:

  • % of MQLs followed up within SLA.
  • Time from MQL → first activity by rep.
  • Breach frequency by team or lead source.

This turns SLA enforcement into a performance metric that sales leaders can coach against.


  • Timestamping every stage without clear logic (leads to data overwrites).
  • Spreading SLA logic across too many workflows (creates operational debt).
  • Ignoring suppression logic (spammy alerts get ignored).
  • Skipping alignment with Sales Ops (if they don’t buy in, enforcement fails).

HubSpot SLA enforcement is about precision, not volume. Fewer, smarter workflows win. So, use custom date stamps + breach flags for clean reporting and scalability. Remember that daily evaluation workflows keep your system stable. Also, HubSpot RevOps automation works best when alerts and dashboards reinforce each other.

Ready to make SLA enforcement actually work? Our HubSpot SLA workflows are built for clean data, accurate tracking, and zero chaos so your sales team follows up faster, and you have the dashboards to prove it. Let’s talk about SLA enforcement that actually works. Book a call!