Revenue Analytics 2.0: The Shift from Lagging to Leading Indicators – Part 1
Rachit Puri

Delivery Partner
The modern RevOps engine runs on velocity, not vanity metrics.
Most revenue teams have build their dashboards like post-race analysts: looking backward, measuring what already happened, and wondering why they missed their number. Pipeline coverage looked good last quarter. Attribution reports came in after the campaign closed. Sales reviewed performance after the deals were already lost.
Revenue Analytics 2.0 flips the script. It helps you shift from delayed dashboards to real-time, leading indicators that guide action before pipeline slips, not after.
This article will break down:
- The difference between leading and lagging indicators (and why many teams get it wrong)
- The five categories of leading indicators that drive GTM decision-making
- How to build dashboards that enable faster, smarter action across marketing, sales, and customer success
The Problem with Traditional Reporting
Traditional revenue reporting lags behind the pace of modern GTM teams. It was designed for end-of-quarter summaries, not day-to-day decision-making.
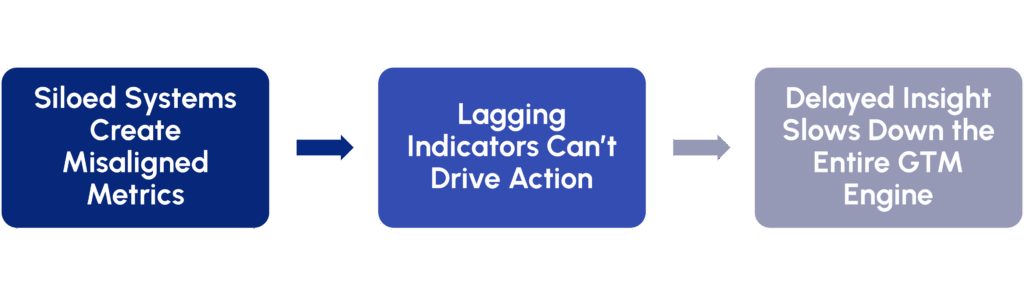
- Siloed Systems Create Misaligned Metrics
Marketing, sales, and customer success often rely on different tools for different things. For example, they use tools like HubSpot / Marketo for email engagement, Salesforce for pipeline tracking, Outreach / Apollo.io for outbound sales sequencing, Salesforce for Contact / Account / Opportunity Management, and many others for small day to day use cases. Each of these tools generates its own definitions of success. This lack of integration makes it nearly impossible to track buyer progression or campaign influence across the entire lifecycle. - Lagging Indicators Can’t Drive Action
Most reporting surfaces past outcomes like deals closed, records generated by source / channel, emails engagements, and campaigns completed. These metrics validate what happened but offer limited visibility into what’s likely to happen next. This leaves revenue teams stuck in diagnostic mode after the fact. - Delayed Insight Slows Down the Entire GTM Engine
When teams lack access to predictive signals, they fall out of sync. Marketing can’t optimize campaign spend mid-flight, sales can’t spot stalled deals early, and leadership can’t course-correct in time to hit the forecast. The cost isn’t just operational. It results in pipeline leakage and missed revenue targets across marketing, sales, customer success, and the broader GTM team.
Defining Leading vs Lagging Indicators
To achieve Revenue Analytics 2.0, teams must start with a clear understanding of what they’re measuring and why, and build a modern, holistic revenue analytics engine around it.
| Aspect | Lagging Indicators | Leading Indicators |
| Nature | Retrospective – tell you what happened after the fact. | Predictive – highlight where attention is needed before outcomes are locked. |
| Purpose | Validate performance and support long-term planning. | Surface early warning signs, momentum shifts, or conversion blockers while there’s still time to act. |
| Decision Impact | Provide no leverage for in-cycle decisions. | Enable intervention while deals are still alive and buyers are still deciding. |
| Common Questions Answered | How many contact us form submissions happened? Which marketing campaigns generated the highest engagement? Which sales teams add the most activities or engaged accounts? | Where is buying committee engagement dropping? Are demo follow-ups happening on time? Are key metrics falling below baseline? |
| Examples | • Records by Source & Channel • Number of Activities logged by Sales Team across regions/segments • Campaign-sourced MQL volume • Pipeline created last quarter • Pipeline Won / Loss review | • Demo Request / Meeting booked and follow-up SLA Monitoring • Establishing buying groups on Opportunities • Measuring Buying committee engagement dropping mid-funnel • Meetings booked-to-SQL ratios falling below baseline • High-intent leads engaging but not routed • Pipeline velocity slowing in key segments / regions |
8 Categories of Leading Indicators
Revenue teams need diagnostic visibility, i.e., metrics that surface friction, progression, or risk before outcomes are locked. We group these signals into five different categories:
- Funnel Progression Indicators
- Description: These metrics track movement, velocity, and flow through your funnel.
- Typical Use Cases: A RevOps leader notices slower MQL-to-SQL conversion in the enterprise segment. They adjust SDR outreach timing to speed up progression and protect pipeline velocity.
- Metrics:
- MQL-to-SQL conversion time by segment
- % of opportunities with engaged buying group contacts
- Pipeline coverage by region, persona, or product
- Engagement Quality Indicators
- Description: These metrics measure whether the right people are engaging with the right content and whether that engagement signals buying intent.
- Typical Use Cases: A Demand Gen manager sees strong engagement from ICP accounts in a new vertical. They double down on content and ads tailored to that segment to drive a more qualified pipeline.
- Metrics:
- ICP match rate on inbound leads
- Content engagement score weighted by asset value
- Buying committee engagement across channels
- Pre-Sale Account & Opportunity Risk Indicators
- Description: Early warning signals that active opportunities are losing momentum or at risk before close.
- Typical Use Cases: A Sales Ops lead notices that 40% of enterprise opps in the evaluation stage show no new stakeholder activity in 14 days. They trigger an exec sponsor outreach play to re-engage decision makers and revive stalled deals.
- Metrics:
- Decline in multi-contact engagement within open opps
- No logged activity for X days on late-stage deals
- Buying committee engagement score trending down mid-funnel
- Competitor mentions rising in discovery/negotiation calls
- Account and Opportunity Risk Indicators (Post-Sale)
- Description: These are early signals of churn, deal loss, or renewal risk. These indicators flag at-risk accounts before revenue is lost.
- Typical Use Cases: A Customer Success manager sees reduced product usage from a renewal account. They trigger a save play with tailored support and sales follow-up before the renewal is lost.
- Metrics:
- Decline in multi-contact engagement
- Drop in product usage velocity before renewal
- Surge in unresolved support tickets tied to open opportunities
- Sales Activity-to-Outcome Indicators
- Description: These metrics tie rep behavior to actual pipeline movement, revealing what’s productive, not just what’s busy.
- Typical Use Cases: A Sales Ops lead spots a low meeting-to-SQL ratio for one team. They tweak outreach strategy and coach the reps to improve conversion from booked meetings to real opps.
- Metrics:
- Meetings booked-to-SQL ratio
- Tiered outbound response rate (Tier 1 vs. Tier 3 accounts)
- SLA compliance on MQL follow-up
- Campaign Efficiency Indicators
- Description: These metrics show whether campaigns are driving real movement in the funnel. They bridge the gap between engagement and revenue contribution.
- Typical Use Cases: A Marketing Ops lead compares campaign conversion rates and reallocates budget from low-impact webinars to high-performing case study assets that generate qualified opportunities.
- Metrics:
- First-touch influence rate on ICP accounts
- Multi-touch conversion probability by campaign type
- Content-assisted opportunity creation rate
- Customer Success Leading Indicators
- Description: Predictive signals of adoption, engagement, or relationship health that impact retention and expansion.
- Typical Use Cases: A Customer Success Manager sees that a renewal account’s health score has dipped due to falling feature adoption and sponsor disengagement. They trigger a save play involving enablement sessions and exec-to-exec alignment before renewal is at risk.
- Metrics:
- Decline in product usage velocity leading up to renewal
- Executive sponsor no longer attending QBRs
- % of licenses unactivated > baseline
- Customer health score dropping 10%+ in 30 days
- Customer Support Leading Indicators
- Description: Metrics that surface friction or dissatisfaction in support interactions before it impacts CSAT or churn.
- Typical Use Cases: A Support manager sees backlog aging spike for Tier 1 accounts. They reallocate resources and spin up a proactive outreach plan to reduce escalations and protect customer experience.
- Metrics:
- First-response SLA breaches rising on priority tickets
- Ticket reopen rate trending above baseline
- Escalation frequency increasing on key accounts
- Backlog aging >7 days even at steady volume
Selecting between Leading and Lagging indicators
Leading indicators drive action. Lagging indicators measure results. A high-performing revenue engine requires both and the ability to move between them with precision.
Dashboards that focus only on lagging metrics can’t guide in-quarter execution. On the other hand, teams that ignore historical outcomes lose sight of what actually works. The solution is to connect the two across the entire customer lifecycle.
This is where advanced models for processes like marketing attribution, opportunity management, and customer lifecycle analytics become critical. Attribution models connect revenue back to the campaigns and touchpoints that drove it, while lifecycle analytics reveal how buyers progress or stall, at each stage of the journey.
When combined with real-time leading indicators, these models create a unified reporting layer that supports both daily execution and quarterly planning.
Transitioning to Revenue Analytics 2.0
Most companies already have the data they need. But it’s buried under dashboards overloaded with lagging metrics. Pipeline slippage, engagement drop-offs, content value trends, and buying signals often sit hidden across Salesforce, HubSpot, and other RevOps tools. Without surfacing these leading indicators, teams are left steering with the rearview mirror.
In Revenue Analytics 2.0 Playbook: Operationalizing Leading Indicators – Part 2, we establish the framework, and share playbook examples for each of the revenue analytics categories.
RevOps Global offers Revenue Analytics Indicator Audit to initiate your transition process. The audit is designed to expose the signals your current dashboards miss and connect them back to real-time GTM execution. We’ll take a deep dive into your existing dashboards and revenue processes to:
- Identify high-impact leading indicators you’re missing
- Uncover cross-object blind spots in your Revenue Operations Tech Stack
- Benchmark your reporting stack against RevOps Global frameworks
- Recommend actions you can take in the next 30 / 60 / 90 days
Whether you’re a VP of RevOps building lifecycle governance, a Demand Gen lead optimizing campaign performance, or a Sales Ops manager trying to reduce deal risk—this audit will give you the visibility you need to lead, not just report.
Schedule a 1:1 to learn more about Revenue Analytics 2.0 audit.